Introduction
According to statistics released by Chinese Customs, China’s import of palm oil in 2021 recorded a marginal drop of 1.3% or 84,400 MT against the previous year. The drop didn’t come as a surprise despite the Y-o-Y growth of 23.6% recorded in the first 6 months of 2021, as escalating vegetable oils’ prices caused many traders and importers to ration their imports pace towards the end of last year. Besides that, lower than expected growth in CPO output also became as another important factor that contributed to the slowdown in imports. Nevertheless, a closer study on the import of other types of palm products found that there is a composition change in the type of palm products being brought in by the importers but serving the similar end customers or for the same application.
Import of Palm Fractions in 2021
The import of palm oil, which is referring to products declared under HS Code 1511 dropped marginally in 2021. The total palm oil (hereafter referring to palm products declared under HS Code 1511) import was recorded at 6.38 million MT, marginally lower than the 6.46 million MT recorded in 2020. This marks the drop in palm oil import for the 2nd consecutive year despite the recovery in CPO output which was the main factor that contributed to the drop back in 2020 import. Furthermore, with the faster revival of economic activities in China (GDP grew 8.1%) as compared to the rest of the world, demand for basic commodities benefited from this development as most of them are essential raw materials or ingredients in supporting the industrial activities, be it in food or non-food sectors. This is supported by the fact that oils & fats demand in 2021 increased by 1.35 million MT (Oil World).
Despite of the overall increase in the demand of oils and fats in 2021, the imports of palm oil registered a decline. One main reason for this decline was the increase in soybean oil and rapeseed oil import in China. At the same time, local outputs of these 2 vegetable oils have also recorded positive growth though marginally. But with the sharp decline in the import of sunflower seed oil by 670,000 MT in the same year, it almost offset the total growth in both output and import of soybean oil and rapeseed oil at 700,000 MT.
Further study into the import volume of palm fractions last year witnessed that the drop in import mainly came from RBD Palm Stearin (RBD PS) (-80,200 MT) which contributed to the total decline in palm oil import in 2021.
Chart 1: China’s Import of Palm Fractions

The decline in the imports of palm sterain is partly attributed to the increase in tallow output in China, which recorded an increase of 119,000 MT last year. While the increase in tallow output may offset the supply-demand gap created by RBD PS, as most tallow and RBD PS are mainly used in fatty acid and glycerine production, it is not sufficient to produce the additional stearic acid and glycerine that have increased by 140,000 MT in the same year. Further study into the import of other types of palm products answered the discrepancy that appeared between the oleochemicals output and the supplies of feedstock.
Increase in the Import of Other Palm Products
Aside from palm oil, there are 2 types of palm products that witnessed a sharp increase in import in 2021, namely hydrogenated vegetable oils and shortening.
Hydrogenated vegetable oils
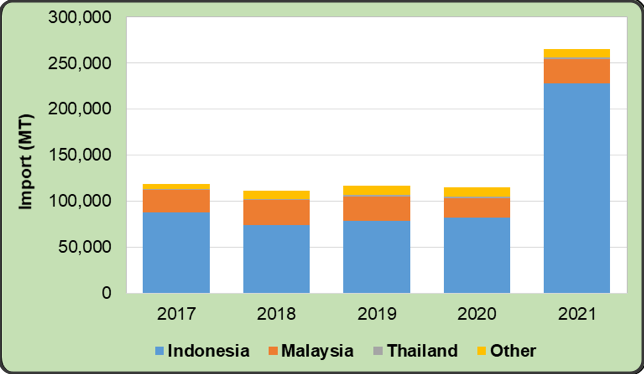
Chart 2 shows the import of hydrogenated or interesterified vegetable oils imports in China in the past 5 years. The import volume of this vegetable oil product has been maintained at slightly below 120,000 MT between 2017 and 2020, indicating that the demand for this product is rather matured until it jumped significantly in 2021 by close to 150,000 MT, or 130%. Besides that, the increase mainly came from Indonesia by 146,000 MT from 82,000 MT to 228,000 MT. Further clarification sought from the industry sources indicates that the increase in hydrogenated vegetable oils from Indonesia was mainly hydrogenated palm stearin (HPS). This palm product is to cater to the oleochemicals industry as feedstock in substitution of RBD PS to produce stearic acid and glycerine, as there is no import duty for this product under the ASEAN-China FTA, as compared to the 2% import duty for RBD PS imposed by China.
Chart 2: Import of Hydrogenated Vegetable Oil (2017-2021)
The most important factor that triggered the export was the change in export duty & export levy for palm products in Indonesia since Jan 2021. The upward revision (though was later revised downward in Jul 2021), has given room for local downstream manufacturers to be able to source cheaper feedstock (CPO & refined palm products) and at the same time pay no export duty and levy. This led the price of further downstream palm products (in this case HPS) to become more competitive in the international market against refined palm product (in this case referring to RBD PS) which need to pay high export tax and levy. Hence, this explains why the import of RBD PS in China dropped in 2021, as some oleochemicals producers have switched to the use of cheaper HPS instead of RBD PS, where the increase in the import volume of HPS able to satisfy the needs in the producing the higher stearic acid and glycerine.
Shortening
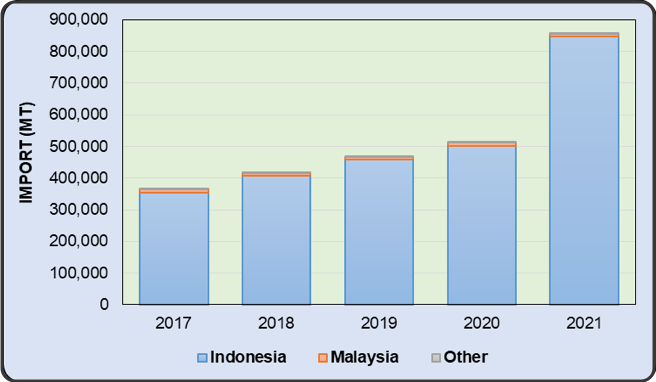
Another palm product that also witnessed a surge in import is shortening, which jumped significantly in 2021 by 340,000 MT or 68% (Chart 3).
Similar to hydrogenated palm oil, shortening is also enjoying 0% import duty under ASEAN-China FTA, and at the same time again, the exporter in Indonesia pays no export duty and levy. As such, the shortening shipped to China almost all (99%) came from Indonesia. Most of these shortenings shipped to China are mainly not for the use in the bakery sector but are meant for food and non-food processing sectors with most of them being sold as frying shortening with different melting points. Hence, these shortenings have the same physical properties as various palm fractions shipped in bulk.
Chart 3: Import of Shortening in China (2017-2021)
Although the delivery of shortening involves additional costs on processing and packaging as compared to the bulk, the discount of the product cost (shortening) against RBD Palm Olein (RBD PL) was so attractive that it offset the additional packaging cost. Furthermore, boxes or drum packaging is preferred by the small manufacturers as most of them do not have or are not willing to put up storage tanks to stock oils delivered by tankers.
With the export duty and levy sharply raised by the Indonesian government in Jan 2021, it made the shortening cost even lower. This led more Chinese users to switch from bulk to carton delivery as the discount is huge enough to spend an additional cost to hire manpower for unpacking the shortening and also the skin-lost while unpacking, subsequently leading to a sharp increase in shortening import in 2021. As these shortenings are meant for both food and non-food processing, such as hotpot soup stock, instant noodle frying, and candle wax production, to partially replaced RBD PL and RBD PS.
Structural Change in the Import of Palm Products’ Composition
Based on the sharp rise in imports of shortening and HPS, the total palm oil being imported by China for general food and non-food processing should not be solely confined to palm fractions declared under HS Code 1511 but encompasses HPS and shortening. Hence, if we sum up the import volume of all these palm products, the total import volume of palm oil amounted to an estimated 7.08 million MT in 2021, which would be a positive growth of 6.1% against the total volume imported in the previous year (Table 1). This also indicates that palm oil or palm products are still able to find their market in China despite the rising prices in 2021. The only thing that is slightly different from previous years is the composition of palm products being imported by China.
Table 1: Total Import of Palm Oil, HPS and Shortening
| (million MT) | 2017 | 2018 | 2019 | 2020 | 2021 |
|---|---|---|---|---|---|
| Palm oil | 5.08 | 5.33 | 7.55 | 6.46 | 6.38 |
| Hydro Vegetable Oil-HPS1 | – | – | – | – | 0.15 |
| Shortening2 | 0.07 | 0.12 | 0.17 | 0.21 | 0.55 |
| Total | 5.15 | 5.45 | 7.72 | 6.67 | 7.08 |
| Growth | +5.8% | +41.7% | -13.6% | +6.1% |
Note:
1. Import before 2021 was mainly hydrogenated palm kernel oil products, only in 2021 that HPS became a major hydrogenated vegetable oil. Hence, it is estimated that 120,000 MT of hydrogenated veg oil was imported annually for conventional use (bakery & confectionery fats), and HPS import vol. in 2021 is estimated at total import minus the 120,000 MT consumed annually.
2. Estimated shortening import volume for non-bakery sector use.
Source: Chinese Customs and MPOC Estimates
With the sudden surge in HPS import volume, it has caused a change in the composition of imports commanded by RBD PL and RBD PS all these years. The 2 major palm fractions accounted for a total of 99% of total palm oil import but with the increase in HPS and shortening import, the share of import has been reduced to 90%, with 7.5% and 2.0% accounted for by shortening and HPS respectively (Table 2).
Table 2: Composition of Palm Oil, HPS and Shortening Imported in China
| 2017 | 2018 | 2019 | 2020 | 2021 | |
|---|---|---|---|---|---|
| RBD PL | 66.6% | 65.0% | 71.6% | 69.1% | 65.3% |
| RBD PS | 31.3% | 32.1% | 25.1% | 27.1% | 24.4% |
| Other PO | 0.8% | 0.7% | 1.0% | 0.6% | 0.4% |
| Hydro Vegetable Oil – HPS | 0.0% | 0.0% | 0.0% | 0.0% | 2.0% |
| Shortening | 1.4% | 1.8% | 2.2% | 3.1% | 7.5% |
Source: Chinese Customs and MPOC Estimates
And if we study carefully the composition between RBD PL and shortening, and also between RBD PS and HPS, we can see that the drop in RBD PL’s import share in 2021 was being taken over by shortening, while the RBD PS is being replaced by HPS.
Conclusion
With the palm oil prices continuing to stay at their current high level, the export duty and levy structure imposed by the Indonesian government will certainly cause the export of palm derivatives such as shortening, oleochemicals, hydrogenated vegetable oils, etc. remain high. This is proven through the import volume of hydrogenated vegetable oils and shortening in China for the Jan-Feb period this year, where both products recorded an increase of 111.8% and 28.7% respectively.
Table 3: Import of Various Palm Products in China (Jan-Feb 2022)
| Jan-Feb 2021 | Jan-Feb 2022 | Change (Vol.) | Change (%) | |
|---|---|---|---|---|
| RBD PL | 766,971 | 167,922 | -598,979 | -78.1% |
| RBD PS | 315,028 | 143,649 | -171,379 | -54.4% |
| Other PO | 2,707 | 990 | -1,717 | -63.4% |
| Hydro Vegetable Oil – HPS | 30,524 | 64,650 | 34,126 | 111.8% |
| Shortening | 107,306 | 138,136 | 30,830 | 28.7% |
Source: Chinese Customs
On the contrary, imports of both RBD PL and RBD PS dropped by 78.1% and 54.4%. Besides the surging palm oil prices, the drop in RBD PL and RBD PS export was due to the DMO policy imposed by the Indonesian government in restricting the export of palm oil to ensure sufficient supplies of cooking oil in the local market. Since this policy has been abolished and being replaced with higher export duty and levy imposed in Mar this year, it will lead to the higher composition of HPS and shortening in total palm products imported by China this year should this policy remains unchanged until the end of the year.
Prepared By: Desmond Ng
*Disclaimer: This document has been prepared based on information from sources believed to be reliable but we do not make any representations as to its accuracy. This document is for information only and the opinion expressed may be subject to change without notice and we will not accept any responsibility and shall not be held responsible for any loss or damage arising from or in respect of any use or misuse or reliance on the contents. We reserve our right to delete or edit any information on this site at any time at our absolute discretion without giving any prior notice.