A comprehensive inventory of land-use and agricultural emissions was published in Nature (January 2021) and highlighted that agricultural activities contributed 25% to the total anthropogenic GHG emissions throughout the period of 2001-2017, driven by rising emissions per land area. Using time series data on population, agricultural production, land area and emissions, the authors revealed the following:
- There is a huge distinction among geographical regions in terms of global emissions. The highest emitting nations are the poorer regions of Southeast Asia, Latin America and sub-Saharan Africa; linked to agricultural land expansion. The more affluent Global North including North America, Europe and Oceania showed negative land use change emissions but agricultural emissions are substantial and flat. East Asia, South Asia and the Middle East, termed by the authors as emerging markets, produced less land use change emissions, however, its agricultural emissions are strongly increasing in line with population expansion.
- Land use change to cropland represents 70% of global net emissions among agricultural processes over the period of 1961-2017.
- Cereals (including rice) has the highest global emissions among agricultural products over the same period of 1961-2017, followed by beef. These two products contributed 71% of global net emissions. Wood has the third highest emissions up until 2008, after which oil crops took over its spot as the third highest emittor.
- The emissions per calorie of beef and other red meats such as buffalo, sheep and goat are 30 times greater than the average intensity of other products. These red meats supplies only 1% of calories produced globally, but are responsible for 25% of the global land use emissions.
- On the other hand, although oil crops are the second largest behind cereals in terms of agricultural production and production per capita, it has one of the lowest land intensity (expressed in ha per calorie) and emissions intensity (expressed in emissions per calorie).
- A shift in red meat consumption was observed. Beef production increased much less than white meat such as chicken and pork throughout the period of 1961-2017 and resulted in reduction of 44% of emissions per capita and 14% of land use emissions per capita.
- A detailed analysis comparing oil crop among regions showed that the largest land use change emissions came from Latin America & Caribean region (Figure 1), corresponding to the land clearing for planting of soy particularly in the Amazon and Argentina (Figure 2)
- There are plenty of opportunities to mitigate agricultural emissions highlighted in the paper including yield improvements, better soil and livestock waste management practices, dietary changes and most importantly reducing food waste.
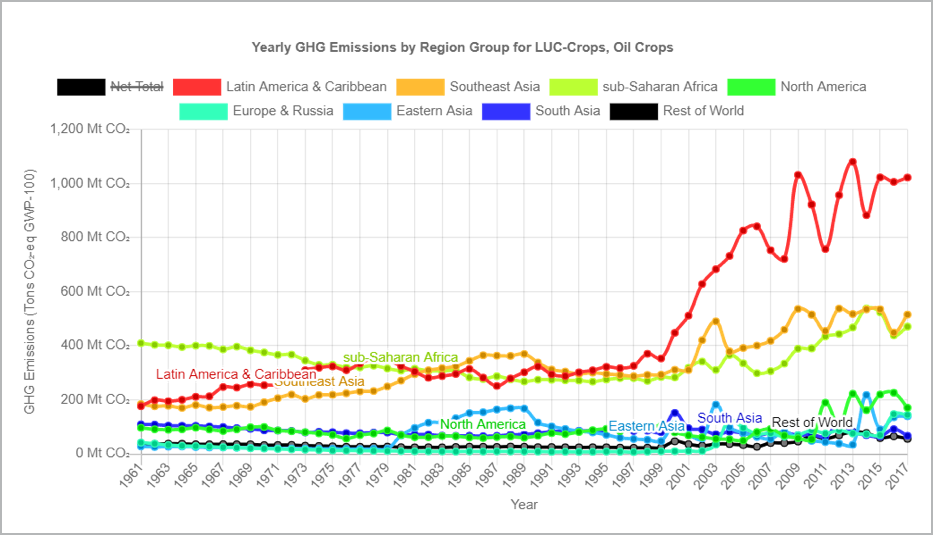
Figure 1: Comparison of annual land use change emissions of oil crops among geographical regions from 1961-2017 (Modified from: Hong et al 2021)

Figure 2: Changes in 2007–2017 in Pale factors of the 50 country–product sources with the largest annual emissions. a–d, Bars show the per cent change in annual land-use emissions (a), per capita production (b), land intensity of production (c) and emissions intensity of land use (d) for each country–product combination (extracted from Hong et al 2021)
In addition to emissions according to region and products, the top 50 country-agricultural products with highest emissions were also highlighted (Figure 2). Malaysian oil palm, listed at no. 40, has its emission figures 7 times lower than the top emission source that is Indonesian rice. As expected, land hungry oil crops such as soy from Brazil and Argentina produces emissions 6.5 and 2.1 times more than Malaysian oil palm.
Malaysian oil palm also demonstrated significantly lower percent changes in annual land use emissions and negative emissions intensity of land use in comparison with other top emitting country-products such as Ethiopian Roundwood, Thai rice, Tanzanian maize, Australian & Chinese wheat, Argentinian soy etc. (Figure 2a, 2d). This also showed that throughout the period of 2007-2017, Malaysia undergo a period of land intensification rather than land expansion (1). Data on oil palm planted area in Malaysia showed increase of 1.6 mil ha (37 %) throughout the same period (Figure 3; see also Figure 4a for comparison within Southeast Asian countries).
Malaysian palm oil has also demonstrated improving its oil yields (Figure 2c), and still has the potential to further improve its productivity, currently at 4 t ha−1 yr−1 up to 10 t ha−1 yr−1 (2).
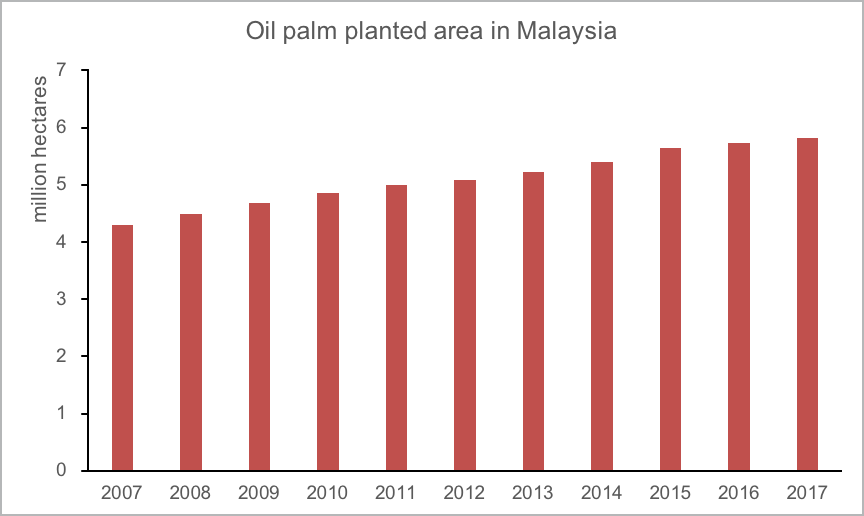
Figure 3: Oil palm planted area in Malaysia 2007-2017 (Source: Malaysian Palm Oil Board)
The rapid growth of the palm oil industry in Malaysia and Indonesia resulted in intensive land use change as well as conversion of peatlands. The conversion of peatlands to oil palm plantation is the second largest contributor to annual emissions in Southeast Asia (Figure 4b), with emissions mainly coming from Indonesia (Figure 4c). Malaysia, on the other hand, has a rather constant trend of emissions since 1990s (Figure 4c).
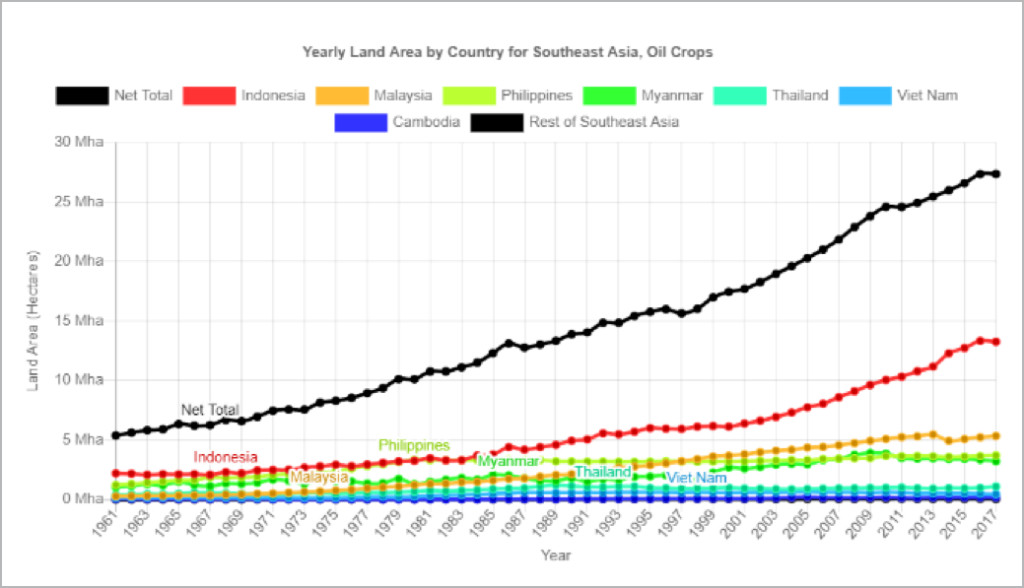


Figure 4: Changes in (a) planted area and (b) annual GHG emissions among oil crops within Southeast Asia countries; and (c) annual GHG emissions of processes from oil crops in Southeast Asia from 1961-2017 (Modified from Hong et al 2021)
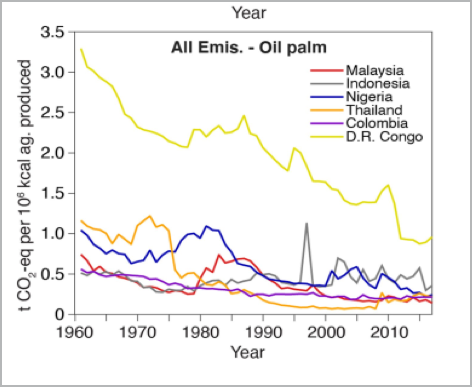
It is also interesting to note that the trends in emissions intensity of Malaysian oil palm is decreasing and has been of the lowest among palm oil producing countries (Figure 5). This trend can be further improved through current mitigation action such as the biogas capture from palm oil mill effluent, which has resulted in emission reduction of 2,377.84 Gg CO2 eq in 2016 (3), and is projected to increase up to 4,903.65 Gg CO2 eq by 2030 (4).
*For further reading, the paper can be viewed here. Supplementary data used to create Figures 1 & 4 are provided by the authors and can be assessed here.
References
- Varkkey, H., Tyson, A., & Choiruzzad, S. A. B. (2018). Palm oil intensification and expansion in Indonesia and Malaysia: Environmental and socio-political factors influencing policy. Forest Policy and Economics, 92, 148-159.
- Woittiez, L. S., van Wijk, M. T., Slingerland, M., van Noordwijk, M., & Giller, K. E. (2017). Yield gaps in oil palm: A quantitative review of contributing factors. European Journal of Agronomy, 83, 57-77.
- Malaysia Third Biennial Update Report to the UNFCCC. Available at https://unfccc.int/documents/267685
- Malaysia Second Biennial Update Report to the UNFCCC. Available at https://unfccc.int/documents/182748