AFRICA REGION
Malaysian Palm Oil Exports Performance
(January – December 2023)
Regional Summary
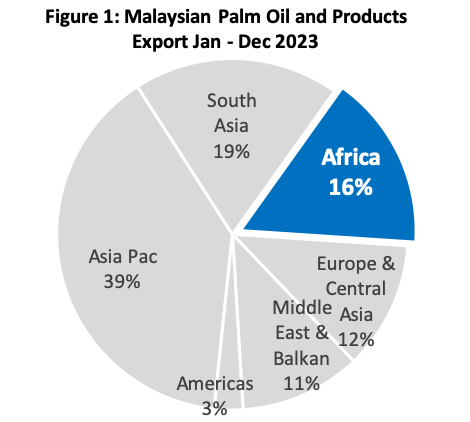
Africa region accounted for 16% of the total Malaysian palm oil and palm products exported in Jan – Dec 2023. Palm oil is the highest imported commodity with market share 93% or 3,618,605MT. The remaining 7% are made of palm-based oleochemical (3%), PKO (2%), finished products (2%). Sodium Fatty Acid Salt contributed the most to the growth in other palm products component.
| Table 1: Malaysian Palm Oil and Palm Product Export to Africa | ||||
|---|---|---|---|---|
| Products | Jan – Dec 2023 |
Jan – Dec 2022 | Change (MT) | Change (%) |
| Palm Oil | 3,618,605 | 3,055,034 | 563,571 | 18.45 |
| Palm-Based Oleo | 131,514 | 134,822 | (3,307) | (2.45) |
| Palm Kernel Oil | 80,748 | 56,394 | 24,354 | 43.18 |
| Finished Products | 63,708 | 84,314 | (20,606) | (24.44) |
| Other Palm Products | 7,005 | 808 | 6,197 | 766.69% |
| 3,901,580 | 3,331,372 | 570,208 | 17.12% | |
Featured Analysis
- Kenya, Egypt, Tanzania, Nigeria, Djibouti, Mozambique, Togo, South Africa, Benin, Senegal, Mauritania and Madagascar are the top importers of Malaysian palm oil and palm products in Africa. These 10 markets accounted for almost 90% of total Malaysia exports to the region.
- African market can now be considered a crude market with import ratio of crude to refine stood at 70:30. Crude palm oil and palm olein went mostly to Kenya, Mozambique, Nigeria, Tanzania and Togo. Lower crude oil import tax and the abolishment of import duty on crude products in market such as Kenya and Tanzania have encouraged more imports of CPO and CPL by the region. During the reviewed period, both CPL and CPO imports went up by 55% and 35% respectively. Cooking oil import is also on the rise, with import volume in 2023 increased by 31% from 667,713 MT to 875,533 MT.
- Soap noodles and glycerine constitute almost 70% of the total palm based oleochemical products into the Africa market. A significant increase recorded in imports of other palm products which constitute mostly Sodium Fatty Acid Salt imported by Ghana.
- The scarcity of US dollar has become critical issues in Africa and has seriously affected their economy. Countries like Kenya, Egypt, Zimbabwe, Nigeria, Ghana and Zambia were among the countries experienced US dollars shortages in 2023. These countries suffered at least 15% drop in their currency value against US dollar. Dollar scarcity crisis has had a significant impact on local consumers and business. Import costs have surge, fueling inflation and causing hardships for people across the continent.
North Africa
Malaysian palm oil export to North Africa during Jan – Dec 2023 declined by 3.92% as compared the volume exported in 2022. Decline in imports of Malaysian palm oil by Egypt was the main factor that contributed to the overall reduced imports by the region. Egypt import of Malaysian palm oil dropped by 20.09% or 70,337 MT. Higher sunflower oil imports has resulted in lower palm oil imports as the Egyptian market shifted towards sunflower oils due to its competitive prices.
Djibouti has overtaken Egypt as the leading importers of Malaysian palm oil during the period in review. Djibouti is the primarily being used as entry point for re-export to Ethiopia and the total imports of MPO in 2023 increased by 9.5% or 26,330 MT. Other markets with positive import growth include Somalia, Morocco, Libya and Tunisia. Morocco, Libya and Tunisia recorded an outstanding growth between 113% and 200% in 2023 period.
| Table 2: Malaysian Palm Export to North African Countries | |||||
|---|---|---|---|---|---|
| COUNTRY | Jan – Dec 2023 | Jan – Dec 2022 | Diff (Vol) | Diff (%) | |
| 1 | Djibouti | 303,384 | 277,054 | 26,330 | 9.50 |
| 2 | Egypt | 279,841 | 350,178 | (70,337) | (20.09) |
| 3 | Somalia | 87,222 | 63,487 | 23,736 | 37.39 |
| 4 | Algeria | 14,129 | 19,117 | (4,988) | (26.09) |
| 5 | Morocco | 13,128 | 4,340 | 8,789 | 202.52 |
| 6 | Ethiopia | 6,282 | 6,913 | (631) | (9.12) |
| 7 | Eritrea | 3,065 | 3,913 | (848) | (21.67) |
| 8 | Sudan | 2,561 | 15,250 | (12,689) | (83.21) |
| 9 | Libya | 2,012 | 941 | 1,071 | 113.75 |
| 10 | Tunisia | 628 | 255 | 373 | 145.92 |
| 11 | South Sudan | 115 | – | 115 | |
| Total | 712,368 | 741,448 | (29,080) | (3.92) | |
Source : MPOB
Breakdown of Malaysian Palm Oil Export to North Africa
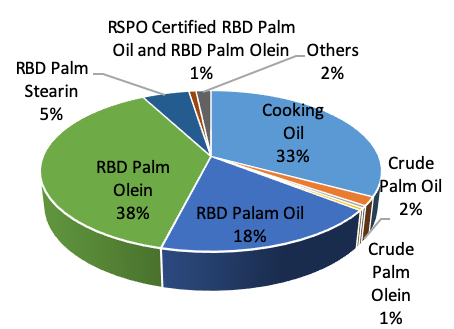
RBD PL, Cooking Oil and RBD PO were three major components of Malaysian palm oil imported by the region and these three products accounted for 89% of the total Malaysian palm oil going into North Africa market. RBD Palm Olein accounted for the most imported palm oil fraction but the volume declined by almost 17%. Similar trend was observed in imports of RBD PO, where import went down by 5%. Higher imports of other vegetable oils, particularly sunflower oil and competitively priced Indonesia palm oil into the Egyptian market, has taken tolls on Malaysian palm oil going into the region
| Table 3: Break down of MPO into North Africa Market | ||||
|---|---|---|---|---|
| Jan – Dec 2023 | Jan – Dec 2022 | Diff (MT) |
Diff (%) |
|
| RBD PL | 272,665 | 326,703 | (54,038) | (16.54) |
| Cooking Oil | 234,245 | 163,862 | 70,383 | 42.95 |
| RBD PO | 130,839 | 137,900 | (7,061) | (5.12) |
| RBD PS | 37,646 | 52,734 | (15,088) | (28.61) |
| CPO | 12,499 | 3,500 | 8,999 | 257.13 |
| CPL | 3,454 | 26,362 | (22,908) | (86.90) |
| PFAD | 3,198 | 6,024 | (2,827) | (46.92) |
| RSPO Certified RBD PO and RBD PL | 5,801 | 15,602 | (9,801) | (62.82) |
| Others | 12,021 | 8,761 | 3,260 | 37.21 |
| Total | 712,368 | 741,448 | (29,080) | (3.92) |
Figure 2: North Africa MPO Import Breakdown
Sub-Sahara Africa (SSA)
During Jan-Dec 2023, the exports of Malaysian palm oil to Sub Saharan Africa region recorded a volume of 2.9 million MT. This is 25.6% or 592,651 MT higher than the the same period in 2022. Kenya continues to be the leading importer of Malaysian palm oil in SSA, with a volume of 915,335 MT of Malaysian palm oil and accounted for 31% of the total MPO exported to the region.
Majority of the markets in SSA have recorded growth in 2023 with the exception of Angola, DRC, Guinea, Comoros and Burkina Faso which recorded declines between 7% – 64%. Higher uptake of Malaysian palm oil in some markets were due to higher demand for CPO and CPL.
| Table 4: Malaysian Palm Oil Export to Sub- Saharan African Countries | |||||
|---|---|---|---|---|---|
| COUNTRY | Jan – Dec 2023 | Jan – Dec 2022 | Diff (Vol) | Diff (%) | |
| 1 | Kenya | 915,335 | 763,060 | 152,275 | 19.96 |
| 2 | Tanzania | 321,438 | 249,169 | 72,269 | 29.00 |
| 3 | Nigeria | 304,043 | 227,035 | 77,008 | 33.92 |
| 4 | Mozambique | 270,084 | 203,162 | 66,922 | 32.94 |
| 5 | Togo | 236,275 | 135,500 | 100,776 | 74.37 |
| 6 | Benin | 136,255 | 92,577 | 43,679 | 47.18 |
| 7 | Senegal | 128,015 | 63,610 | 64,404 | 101.25 |
| 8 | South Africa | 121,396 | 121,138 | 258 | 0.21 |
| 9 | Mauritania | 97,558 | 51,673 | 45,885 | 88.80 |
| 10 | Madagascar | 97,137 | 73,567 | 23,570 | 32.04 |
| 11 | Ghana | 83,342 | 63,255 | 20,088 | 31.76 |
| 12 | Angola | 47,017 | 129,858 | (82,842) | (63.79) |
| 13 | Congo, Democratic Rep. Of The | 32,945 | 35,514 | (2,569) | (7.23) |
| 14 | Cote D’Ivoire | 32,410 | 26,915 | 5,496 | 20.42 |
| 15 | Guinea | 23,215 | 35,777 | (12,562) | (35.11) |
| 16 | Gambia | 19,485 | 11,603 | 7,882 | 67.93 |
| 17 | Cameroon | 13,003 | 11,086 | 1,917 | 17.30 |
| 18 | Liberia | 7,925 | 4,892 | 3,033 | 61.99 |
| 19 | Niger | 4,701 | 3,243 | 1,459 | 44.98 |
| 20 | Mauritius | 4,227 | 3,021 | 1,206 | 39.92 |
| 21 | Gabon | 2,638 | 1,458 | 1,180 | 80.90 |
| 22 | Sierra Leone | 1,347 | 1,141 | 206 | 18.05 |
| 23 | Comoros | 1,252 | 2,274 | (1,022) | (44.94) |
| 24 | Burkina Faso | 1,143 | 1,354 | (211) | (15.55) |
| Others | 4,050 | 1,706 | 2,344 | 137.44 | |
| Total | 2,906,237 | 2,313,586 | 592,651 | 25.62 | |
| Source: MPOB | |||||
Breakdown of MPO Export to Sub-Sahara Africa
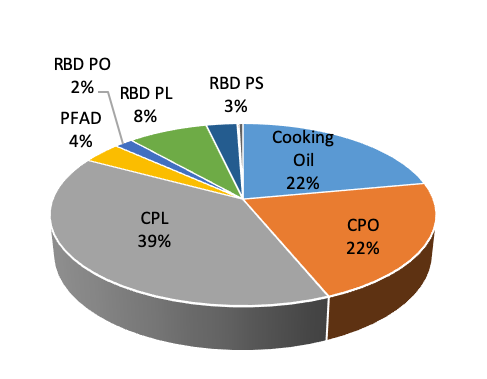
Crude palm oil (CPO, crude palm olein (CPL) accounted for 61% of the total palm oil imported by the region. Most of CPO and CPL went to Kenya, Nigeria, Mozambique and Tanzania. Both RBD PL and RBD PO only accounted for 10% or 282,390 MT of the total palm oil imports and both products have lost its share to crude olien and CPO. Lower crude oil import tax and the abolishment of import duty on crude products in market such as Kenya and Tanzania has encouraged more imports of CPO and CPL by the region. Cooking oil accounted for 22% of the total volume or 641,288 MT of the total palm oil imported by the region. Benin, Togo, Mauritania, Tanzania, Kenya and Senegal were among the major importers of cooking oil in Africa.
| Table 5: Break down of MPO Export to Sub Saharan Africa Market | ||||
|---|---|---|---|---|
| PRODUCT | Jan – Dec 2023 |
Jan – Dec 2022 |
Diff (MT) |
Diff (%) |
| CPL | 1,134,857 | 705,831 | 429,026 | 60.78 |
| Cooking Oil | 641,288 | 503,850 | 137,438 | 27.28 |
| CPO | 631,958 | 582,365 | 49,593 | 8.52 |
| RBD PL | 229,208 | 280,099 | (50,890) | (18.17) |
| PFAD | 110,570 | 102,586 | 7,984 | 7.78 |
| RBD PS | 88,578 | 83,709 | 4,869 | 5.82 |
| RBD PO | 53,182 | 41,091 | 12,091 | 29.42 |
| RSPO Certified CPO, RBD PO and RBD PL | 4,751 | 5,074 | (323) | (6.37) |
| Others | 11,845 | 8,981 | 2,864 | 31.88 |
| Total | 2,906,237 | 2,313,586 | 592,651 | 25.62 |
Figure 3: Sub Saharan Africa MPO Import Breakdown
*Disclaimer: This document has been prepared based on information from sources believed to be reliable but we do not make any representations as to its accuracy. This document is for information only and opinion expressed may be subject to change without notice and we will not accept any responsibility and shall not be held responsible for any loss or damage arising from or in respect of any use or misuse or reliance on the contents. We reserve our right to delete or edit any information on this site at any time at our absolute discretion without giving any prior notice.