AMERICAS REGION
Malaysian Palm Oil Exports Performance
(January – December 2023)
Regional Summary
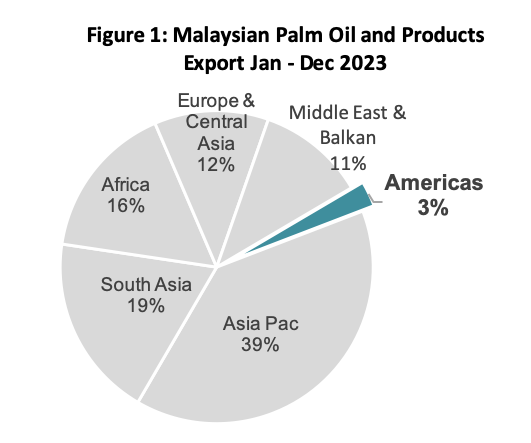
The Americas region accounted for 3% of the total Malaysian palm oil and palm products exported in Jan– Dec 2023. Palm-based oleo assumed an important composition exported to the Americas with market share of 39.2% or 248,865 MT from the total Malaysian palm oil and palm products exported to this region. The second most exported composition is palm oil at 29.7%, followed by palm kernel oil at 10.5%, finished products at 9.5% and biodiesel at 5.2%.
| Table 1: Malaysian Palm Oil and Palm Product Export to the Americas | ||||
|---|---|---|---|---|
| Products | Jan – Dec 2023 | Jan – Dec 2022 | Change (MT) | Change (%) |
| Palm-Based Oleo | 248,865 | 289,224 | (40,359) | (14.0) |
| Palm Oil | 188,556 | 260,230 | (71,673) | (27.5) |
| Palm Kernel Oil | 66,538 | 96,320 | (29,781) | (30.9) |
| Finished Products | 60,175 | 55,867 | 4,308 | 7.7 |
| Other Palm Products | 37,727 | 378 | 37,349 | 9,885.9 |
| Biodiesel | 33,209 | 10,075 | 23,133 | 229.6 |
| Total | 635,070 | 712,094 | (77,024) | (10.8) |
Featured Analysis
- USA, Canada, Trinidad, Mexico, Brazil, Chile, Dominica, Guyana, Panama and Argentine were the top 10 export destinations for Malaysian palm oil in the Americas region during this period, accounting for about 95% or 179,221 MT of the total MPO export to this region.
- Exports of Malaysian palm oil and palm products to this region in 2023, decreased by 10.8% as compared to the volume exported in 2022. Palm-based oleo was the leading export product at 248,865 MT, a decline of 14% y-o-y. Palmitic acid, refined glycerine and soap noodles were the main components of Malaysian palm-based oleo products exported to this region, accounted for 41%. High imports of used cooking oil contributed to a significant growth of other palm products import.
- Export of MPO into Americas declined by 27.5%. RBD stearin, RBD palm oil, RBD palm olein and cooking oil accounted for 45% of MPO going into the region. Out of the total MPO volume, 35% were RSPO Certified RBD PO, RBD PS and RBD PL. Most of MPO exported to Americas region went to USA, which accounted for 62% of the total MPO exported volume.
- According to USDA report, US is expected to intensify its soybean oil import in 2024 in order to supplement increased biofuel demand. Despite prolonged drought in Brazil, positive Argentine soybean recovery will ensure sufficient soybean supply from South America.
Malaysian palm oil exports to the Americas region during January-December 2023 period recorded a total volume of 188,556 MT against 260,230 MT which was registered during the same period of 2022 (refer to Table 2). This represents a decline of 71,673 MT or by 27.5%.
The decline was due to lower purchase of Malaysian palm oil from the biggest buyer in the region, the United States (US). However, the US still leads the palm oil market in terms of market share in the Americas region. The leading palm oil suppliers to the US consisted of Indonesia at around 86% of total import followed by Malaysia at approximately 9.3%. During Jan-Dec 2023 period, total MPO exports to the US went down to 117,523 MT from 193,869 MT recorded during the same period of last year. Canada, another important market for MPO in this region, has been consistently importing palm oil from Malaysia. Total MPO export to Canada increased by 10.2% to 13,928 MT during Jan-Dec 2023 period from 12,637 MT registered during the same period last year (refer to Table 2).
| Table 2: Malaysian Palm Oil Export to the Americas Region | |||||
|---|---|---|---|---|---|
| COUNTRY | Jan – Dec 2023 | Jan – Dec 2022 | Diff (Vol) | Diff (%) | |
| 1 | U.S.A | 117,523 | 193,869 | (76,345) | (39.4) |
| 2 | Canada | 13,928 | 12,637 | 1,291 | 10.2 |
| 3 | Trinidad | 11,452 | 10,507 | 946 | 9.0 |
| 4 | Mexico | 10,245 | 10,450 | (205) | (2.0) |
| 5 | Brazil | 6,964 | 9,383 | (2,419) | (25.8) |
| 6 | Chile | 6,582 | 3,654 | 2,928 | 80.1 |
| 7 | Dominica | 4,240 | 1,199 | 3,041 | 253.6 |
| 8 | Guyana | 3,607 | 1,540 | 2,067 | 134.2 |
| 9 | Panama | 2,718 | 1,067 | 1,652 | 154.8 |
| 10 | Argentina | 1,961 | 2,843 | (882) | (31.0) |
| 11 | Haiti | 1,593 | 2,567 | (974) | (37.9) |
| 12 | Uruguay | 1,563 | 389 | 1,174 | 301.4 |
| 13 | Barbados | 1,270 | 893 | 377 | 42.2 |
| 14 | Suriname | 1,219 | 229 | 989 | 431.2 |
| 15 | Guatemala | 1,040 | 1,272 | (232) | (18.2) |
| 16 | Jamaica | 1,039 | 1,163 | (124) | (10.6) |
| Others | 1,610 | 6,568 | (4,958) | (308) | |
| TOTAL | 188,556 | 260,230 | (71,673) | (27.5) | |
Other markets with positive import growth include Trinidad, Chile, Dominica and Guyana. Dominica recorded the highest increment in terms of volume, increasing by 3,041 MT while Suriname recorded the highest increment in terms of percentage, increasing by 431.2%.
Breakdown of Malaysian Palm Oil Export to USA
In terms of product breakdown to the US, RBD palm stearin, RBD palm oil and RBD palm olein are the top three products exported to US comprising almost 81% of the overall MPO export to US (refer to table 3). Despite being the most imported palm oil fraction, RBD palm stearin has recorded a drop by 27.9%. Similar trend was observed in the exports of RBD palm oil, where export went down by 42.7% as well as for RBD palm olein, where export went down by 58.6%. Higher imports of soybean and sunflower oil by the US offset the reduction of RBD palm oil imports besides competitive price of Indonesian palm oil going into the US market.
| Table 3: Breakdown of MPO Export to the US | ||||
|---|---|---|---|---|
| Jan – Dec 2023 | Jan – Dec 2022 | Diff (MT) | Diff (%) | |
| RBD PS | 39,560 | 54,872 | (15,313) | (27.9) |
| RBD PO | 39,452 | 68,870 | (29,418) | (42.7) |
| RBD PL | 15,196 | 36,721 | (21,525) | (58.6) |
| NBD PL | 13,251 | 17,482 | (4,231) | (24.2) |
| Others | 10,065 | 15,923 | (5,858) | (36.8) |
| Total | 117,523 | 193,869 | (76,345) | (39.4) |
Source: MPOB
Figure 2: MPO Export Breakdown to the US

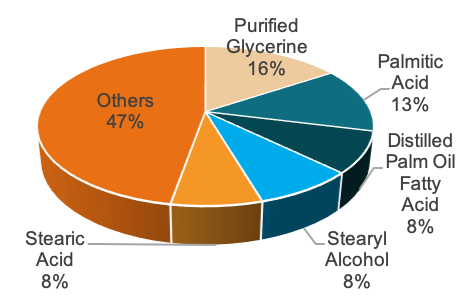
Other than palm oil, Malaysia also exported palm-based oleo, palm kernel oil, finished products and biodiesel to the US. The top 5 exported items under the category of palm-based oleo are purified glycerine, palmitic acid, distilled palm oil fatty acid, stearyl alcohol, and stearic acid (refer to table 4).
| Table 4: Breakdown of Palm-Based Oleo Products Export to the US | ||||
|---|---|---|---|---|
| Jan – Dec 2023 | Jan – Dec 2022 | Diff (MT) | Diff (%) | |
| Purified Glycerine | 22,152 | 33,231 | (11,079) | (33.3) |
| Palmitic Acid | 18,515 | 24,202 | (5,687) | (23.5) |
| Distilled Palm Oil Fatty Acid | 11,759 | 16,295 | (4,536) | (27.8) |
| Stearyl Alcohol | 11,547 | 12,046 | (499) | (4.1) |
| Stearic Acid | 10,369 | 12,076 | (1,707) | (14.1) |
| Others | 66,521 | 94,430 | (27,909) | (29.6) |
| Total | 140,864 | 192,281 | (51,418) | (26.7) |
Figure 3: Palm Oil and Palm Products Export to the US
For more info please contact Mrs Nur Adibah
Email : nuradibah@mpoc.org.my
*Disclaimer: This document has been prepared based on information from sources believed to be reliable but we do not make any representations as to its accuracy. This document is for information only and opinion expressed may be subject to change without notice and we will not accept any responsibility and shall not be held responsible for any loss or damage arising from or in respect of any use or misuse or reliance on the contents. We reserve our right to delete or edit any information on this site at any time at our absolute discretion without giving any prior notice.