AFRICA REGION
Malaysian Palm Oil Exports Performance
(January – November 2023)
Regional Summary
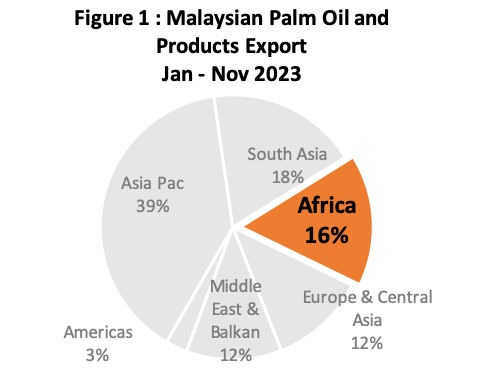
Africa region accounted for 16% of the total Malaysian palm oil and palm products exported in Jan – Nov 2023. Palm oil assumed an important composition of Malaysian palm oil and palm products exported to the region with market share 93% or 3,049,573 MT of the total Malaysian palm oil and products going into Africa. The remaining 7% are made of palm-based oleochemical (3%), PKO (2%), finished products (2%).
| Table 1: Malaysian Palm Oil and Palm Product Export to Africa | ||||
|---|---|---|---|---|
| Products | Jan – Nov 2023 |
Jan – Nov 2022 | Change (MT) | Change (%) |
| Palm Oil | 3,280,444 | 2,739,916 | 540,528 | 20% |
| Palm-Based Oleo | 119,068 | 117,792 | 1,277 | 1% |
| Palm Kernel Oil | 73,948 | 50,049 | 23,899 | 48% |
| Finished Products | 58,932 | 77,823 | (18,890) | -24% |
| Other Palm Products | 6,902 | 590 | 6,312 | 1070% |
| Grand Total | 3,539,295 | 2,986,170 | 553,125 | 19% |
Featured Analysis
- Kenya, Egypt, Tanzania, Nigeria, Djibouti, Mozambique, Togo, South Africa, Benin, and Senegal are the top 10 importers of Malaysian palm oil and palm products in Africa. These 10 markets accounted for 82% of total Malaysia exports to the region.
- Crude palm olein (CPL), cooking oil, crude palm oil (CPO) and RBD palm oil are mostly imported by the region. These four products accounted for 87% of the total palm oil going into the region. Soap noodles and glycerine constitute most of palm based oleochemical products into the Africa market. A significant increase recorded in imports of other palm products which constitute mostly by Sodium Fatty Acid Salt imported by Ghana. Lower crude oil import tax and the abolishment of import duty on crude products in market such as Tanzania has encouraged more imports of CPO and CPL by the region. During the reviewed period, both CPL and CPO imports went up by 45%.
- Somalia has finally become part of the East African Community (EAC), when the country was formally admitted to the bloc as their 8th member country, beside Kenya, Tanzania, Uganda, Rwanda, Burundi, DRC and South Sudan. The EAC was stablished in 2000 and is headquartered in Arusha, Tanzania. Its mission has been to foster economic growth through preferential trade agreement and eliminating customs duties among member states.
- Egypt has been suffering a severe shortage of foreign currency despite a 14.5% devaluation on Oct. 27 and the announcement of a $3 billion support package with the International Monetary Fund. The lack of dollars has tightened the flow of imports for factory and retail inputs. The pound’s depreciation against the US dollar led to a marked increase in prices paid for raw materials, which have already been exacerbated by import restrictions since early-2022 (source: Reuters)
North Africa
Malaysian palm oil exported to Sub Sahara Africa markets during Jan – Nov 2023 was 2.6 million MT. The volume is 26.3% or 550,074 MT higher than the volume recorded in 2022. Kenya continue to be the leading importer of Malaysian palm oil in SSA, imported 784,850 MT of Malaysian palm oil and the volume accounted for almost 30% of the total MPO volume exported to the region. The volume was 12.6% higher than the volume recorded in 2022.
Most of other markets in SSA have also recorded an outstanding import growth in 2023 with the exception of Angola. Guinea and Burkina Faso which recorded declines of 67%, 36% and 15.5% respectively. Higher uptake of Malaysian palm oil in some markets were due to higher demand for CPO and CPL.
| Table 2: Malaysian Palm Export to North African Countries | |||||
|---|---|---|---|---|---|
| COUNTRY | Jan – Nov 2023 | Jan – Nov 2022 | Diff (Vol) | Diff (%) | |
| 1 | Djibouti | 276,587 | 236,900 | 39,687 | 16.8% |
| 2 | Egypt | 245,834 | 311,749 | (65,914) | -21.1% |
| 3 | Somalia | 77,615 | 58,689 | 18,926 | 32.2% |
| 4 | Morocco | 13,085 | 755 | 12,329 | 1632.2% |
| 5 | Algeria | 12,759 | 17,350 | (4,591) | -26.5% |
| 6 | Ethiopia | 4,709 | 6,719 | (2,009) | -29.9% |
| 7 | Eritrea | 3,065 | 2,950 | 115 | 3.9% |
| 8 | Sudan | 2,511 | 12,183 | (9,672) | -79.4% |
| 9 | Libya | 1,817 | 722 | 1,095 | 151.7% |
| 10 | Tunisia | 607 | 234 | 373 | 159.2% |
| 11 | South Sudan | 115 | – | 115 | |
| Total | 638,704 | 648,251 | (9,546) | -1.5% | |
Other markets with positive import growth include Somalia, Morocco, Eritrea, Libya and Tunisia. Morocco recorded an outstanding growth from just 755 MT to 13,085 MT. Morocco has intensify its CPO imports during the reviewed period.
Breakdown of Malaysian Palm Oil Export to North Africa
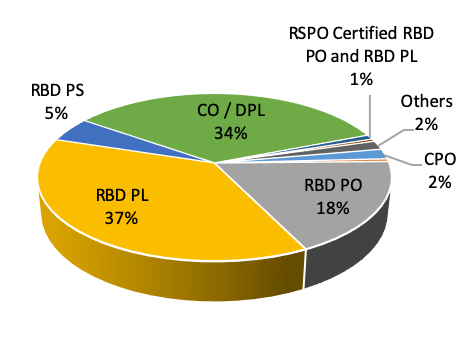
RBD PL, Cooking Oil and RBD PO were three major components of Malaysian palm oil imported by the region and these three products accounted for 89% of the total Malaysian palm oil going into the North Africa market. Despite being the most imported palm oil fraction, RBD Palm Olein has recorded 13.1% dropped. Similar trend was observed in imports of RBD PO, where import went down by 6%. Higher imports of soybean and sunflower oil by Egypt were reflected in the reduction of RBD palm olein imports besides more competitive price of Indonesia palm oil going into the Egyptian market.
| Table 3: Break down of MPO into North Africa Market | ||||
|---|---|---|---|---|
| Jan – Nov 2023 | Jan – Nov 2022 | Diff (MT) |
Diff (%) |
|
| CPO | 12,499 | – | ||
| CPL | 3,454 | 26,362 | (22,908) | -86.9% |
| RBD PO | 114,828 | 122,161 | (7,333) | -6.0% |
| RBD PL | 237,431 | 273,233 | (35,802) | -13.1% |
| RBD PS | 30,995 | 46,091 | (15,096) | -32.8% |
| CO / DPL | 219,447 | 151,106 | 68,341 | 45.2% |
| RSPO Certified RBD PO and RBD PL | 5,801 | 15,601 | (9,800) | -62.8% |
| PFAD | 3,198 | 6,001 | (2,803) | -46.7% |
| Others | 11,051 | 7,695 | 3,356 | 43.6% |
| 638,704 | 648,251 | (9,546) | -1.5% | |
Figure 2: North Africa MPO Import Breakdown
Sub-Sahara Africa (SSA)
Malaysian palm oil exported to Sub Sahara Africa markets during Jan – Oct 2023 reached almost 2.5 million MT. The volume is 30% or 563,124 MT higher than the volume recorded in 2022. Kenya continue to be the leading importer of Malaysian palm oil in SSA, imported 725,911 MT of Malaysian palm oil and the volume accounted for 30% of the total MPO volume exported to the region. The volume was 16.08 % higher that the volume recorded in 2022.
Most of other markets in SSA have also recorded an outstanding import growth in 2023 with the exception of South Africa and Angola which recorded declines of 10.33% and 65% respectively. Higher uptake of Malaysian palm oil in some markets were due to higher demand for CPO and CPL.
| Table 4: Malaysian Palm Oil Export to Sub- Sahara African Countries | |||||
|---|---|---|---|---|---|
| COUNTRY | Jan – Nov 2023 | Jan – Nov 2022 | Diff (Vol) | Diff (%) | |
| 1 | Kenya | 784,850 | 697,053 | 87,797 | 12.6% |
| 2 | Tanzania | 312,144 | 211,743 | 100,402 | 47.4% |
| 3 | Nigeria | 284,770 | 207,011 | 77,759 | 37.6% |
| 4 | Mozambique | 245,134 | 193,580 | 51,555 | 26.6% |
| 5 | Togo | 217,628 | 99,966 | 117,662 | 117.7% |
| 6 | Benin | 136,255 | 75,325 | 60,930 | 80.9% |
| 7 | Senegal | 127,727 | 61,892 | 65,834 | 106.4% |
| 8 | South Africa | 115,897 | 115,923 | (26) | 0.0% |
| 9 | Mauritania | 93,246 | 43,475 | 49,771 | 114.5% |
| 10 | Madagascar | 72,881 | 72,330 | 551 | 0.8% |
| 11 | Ghana | 67,219 | 60,315 | 6,903 | 11.4% |
| 12 | Angola | 41,143 | 126,262 | (85,119) | -67.4% |
| 13 | Congo, Democratic Rep. Of The | 32,400 | 31,658 | 742 | 2.3% |
| 14 | Cote D’Ivoire | 30,950 | 23,004 | 7,946 | 34.5% |
| 15 | Guinea | 22,348 | 34,798 | (12,450) | -35.8% |
| 16 | Gambia | 18,841 | 11,396 | 7,445 | 65.3% |
| 17 | Cameroon | 12,156 | 9,364 | 2,791 | 29.8% |
| 18 | Liberia | 7,925 | 3,772 | 4,153 | 110.1% |
| 19 | Niger | 4,701 | 3,243 | 1,459 | 45.0% |
| 20 | Mauritius | 3,765 | 2,561 | 1,204 | 47.0% |
| 21 | Gabon | 2,513 | 1,154 | 1,358 | 117.7% |
| 22 | Burkina Faso | 1,143 | 1,354 | (211) | -15.5% |
| 23 | Sierra Leone | 1,127 | 992 | 135 | 13.6% |
| 24 | Others | 4,976 | 3,493 | 1,482 | 42.4% |
| 2,641,740 | 2,091,665 | 550,074 | 26.3% | ||
| Source: MPOB | |||||
Breakdown of MPO Export to Sub-Sahara Africa
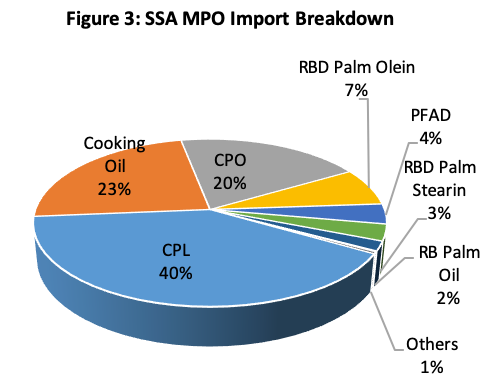
Crude palm oil (CPO, crude palm olein (CPL) accounted for 60% of the total palm oil imported by the region. Most of CPO and CPL went to Kenya, Nigeria, Mozambique and Tanzania. Cooking oil accounted for 23% of the total volume. Refined palm olein has lost its share to crude with import volume of 174,247 MT, 27% lower than the volume recorded in 2022. Lower crude oil import tax and the abolishment of import duty on crude products in market such as Kenya and Tanzania has encouraged more imports of CPO and CPL by the region. Cooking oil accounted for 570,478 MT or 23% of the total palm oil imported by the region. Benin, Togo, Mauritania, Tanzania, Kenya and Senegal were among the major importers of cooking oil in Africa.
| Table 5: Break down of MPO Export to SSA Market | ||||
|---|---|---|---|---|
| PRODUCT | Jan – Nov 2023 |
Jan – Nov 2022 |
Diff (MT) |
Diff (%) |
| CPL | 989,681 | 570,131 | 419,550 | 73.59% |
| Cooking Oil | 570,478 | 405,400 | 165,077 | 40.72% |
| CPO | 483,403 | 453,275 | 30,128 | 6.65% |
| RBD Palm Olein | 178,247 | 244,244 | (65,997) | -27.02% |
| PFAD | 95,414 | 91,819 | 3,595 | 3.92% |
| RBD Palm Stearin | 77,829 | 73,013 | 4,817 | 6.60% |
| RBD Palm Oil | 45,024 | 39,834 | 5,189 | 13.03% |
| RSPO Certified RBD PO and RBD PL | 3,997 | 4,259 | (262) | -6.15% |
| Others | 9,311 | 8,283 | 1,028 | 12.41% |
| 2,453,383 | 1,890,258 | 563,125 | 29.79% | |
*Disclaimer: This document has been prepared based on information from sources believed to be reliable but we do not make any representations as to its accuracy. This document is for information only and opinion expressed may be subject to change without notice and we will not accept any responsibility and shall not be held responsible for any loss or damage arising from or in respect of any use or misuse or reliance on the contents. We reserve our right to delete or edit any information on this site at any time at our absolute discretion without giving any prior notice.