AFRICA REGION
Malaysian Palm Oil Exports Performance
(January – October 2023)
Regional Summary
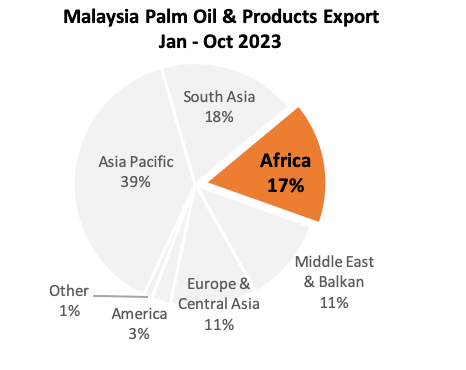
Africa region accounted for 17% of the total Malaysian palm oil and palm products exported in Jan – Oct 2023. Palm oil assumed an important composition of Malaysian palm oil and palm products exported to the region with market share 93% or 3,049,573 MT of the total Malaysian palm oil and products going into Africa. The remaining 7% are made of palm-based oleochemical (3%), PKO (2%), finished products (2%).
| Table 1: Malaysian Palm Oil and Palm Product Export to Africa | ||||
|---|---|---|---|---|
| Products | Jan – Oct 2023 | Jan – Oct 2022 | Change (MT) | Change (%) |
| Palm Oil | 3,049,573 | 2,474,985 | 574,588 | 23% |
| Palm-Based Oleo | 105,112 | 101,860 | 3,252 | 3% |
| Palm Kernel Oil | 64,273 | 44,385 | 19,888 | 45% |
| Finished Products | 53,843 | 71,070 | (17,227) | -24% |
| Other Palm Products | 5,802 | 530 | 5,272 | 994% |
| Grand Total | 3,278,602 | 2,692,830 | 585,772 | 22% |
Featured Analysis
- Kenya, Egypt, Tanzania, Nigeria, Djibouti, Mozambique, Togo, Benin, South Africa and Senegal are the top 10 importers of Malaysian palm oil and palm products in Africa. These 10 markets accounted for 76% of total Malaysia exports to the region.
- Crude palm olein (CPL), cooking oil, crude palm oil (CPO) and RBD palm oil are mostly imported by the region. These four products accounted for 87% of the total palm oil going into the region. Soap noodles and glycerine constitute most of palm based oleochemical products into the Africa market. Lower crude oil import tax and the abolishment of import duty on crude products in market such as Tanzania has encouraged more imports of CPO and CPL by the region. During the reviewed period, both CPL and CPO imports went up by 45%.
- As of the coming months, imports by the region will be challenged by weak currency as some the countries are facing severe currency depreciation against US dollars. Since most Africa countries are dependent on imports of finished goods, they are relying heavily on US dollars or the Chinese yuan to finance imports. Foreign exchange scarcity or higher exchange rates force manufacturers to pay more to import raw materials thus slows down imports and increases the cost of production.
(https://www.bbc.com/news/business-67311012)
- While Northern Ethiopia suffers from droughts, the southern and eastern part of the country, along with Kenya and Somalia have been hit by flooding due to heavy rains in October to November. Approximately 15 million people in East Africa were grappling with food insecurity. The flooding has submerged 1.5 million hactares of land in Somalia. The situation not only exacerbates existing food security but also lead to substantial agricultural losses. Livestock, a crucial livelihood source is also under threat due to the proliferation of vector-borne diseases and the emergence of the new health risk.
https://www.aljazeera.com/news/2023/11/6/kenya-flooding-kills-15-displaces-thousands
North Africa
Malaysian palm oil export to North Africa during Jan – Oct 2023 increased by 2% as compared the volume imported in 2022. Djibouti has overtaken Egypt as the leading importers of Malaysian palm oil during the reviewed period. Djibouti import increased by 42.67% or 79,855 MT. Egypt, on the other hand came second but import of Malaysian palm oil declined by 25.58%. The decline was contributed by higher sunflower and soybean oil import as the Egyptian market enjoyed competitive prices of both items as against palm olein.
| Table 2: Malaysian Palm Export to North African Countries | |||||
|---|---|---|---|---|---|
| COUNTRY | Jan – Oct 2023 | Jan – Oct 2022 | Diff (Vol) | Diff (%) | |
| 1 | Djibouti | 267,021 | 187,166 | 79,855 | 42.67% |
| 2 | Egypt | 227,787 | 306,081 | (78,294) | -25.58% |
| 3 | Somalia | 65,321 | 52,456 | 12,865 | 24.52% |
| 4 | Morocco | 13,047 | 648 | 12,399 | 1913.78% |
| 5 | Algeria | 11,015 | 16,618 | (5,604) | -33.72% |
| 6 | Ethiopia | 4,246 | 6,363 | (2,118) | -33.28% |
| 7 | Eritrea | 3,065 | 2,292 | 773 | 33.70% |
| 8 | Sudan | 2,276 | 12,053 | (9,777) | -81.12% |
| 9 | Libya | 1,744 | 649 | 1,095 | 168.90% |
| 10 | Tunisia | 607 | 106 | 500 | 470.22% |
| 11 | South Sudan | 115 | – | 115 | |
| 596,244 | 584,434 | 11,810 | 2.02% | ||
Other markets with positive import growth include Somalia, Morocco, Eritrea, Libya and Tunisia. Morocco recorded a significant import growth of palm oil from just 648 MT to 13,047 MT. Increase import of CPO by Morocco contributed to the significant change.
Breakdown of Malaysian Palm Oil Export to North Africa
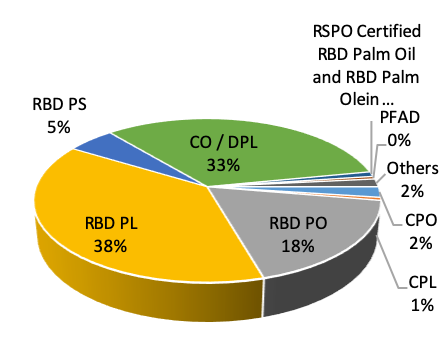
RBD PL, Cooking Oil and RBD PO were three major components of Malaysian palm oil imported by the region and these three products accounted for 89% of the total Malaysian palm oil going into the North Africa market. Despite being the most imported palm oil fraction, RBD Palm Olein has recorded 13.82% dropped. Similar trend was observed in imports of RBD PO, where import went down by 6.45%. Higher imports of soybean and sunflower oil by Egypt were reflected in the reduction of RBD palm olein imports besides more competitive price of Indonesia palm oil going into the Egyptian market.
| Table 3: Break down of MPO into North Africa Market | ||||
|---|---|---|---|---|
| Jan – Oct 2023 | Jan – Oct 2022 | Diff (MT) | Diff (%) | |
| CPO | 12,499 | – | na | |
| CPL | 3,454 | – | na | |
| RBD PO | 106,457 | 113,801 | (7,343) | -6.45% |
| RBD PL | 227,663 | 264,161 | (36,499) | -13.82% |
| RBD PS | 30,995 | 44,458 | (13,462) | -30.28% |
| CO / DPL | 196,715 | 133,093 | 63,622 | 47.80% |
| RSPO Certified RBD PO and RBD PL | 5,801 | 15,602 | (9,801) | -62.82% |
| PFAD | 3,198 | 6,001 | (2,803) | -46.71% |
| Others | 9,461 | 7,318 | 2,143 | 29.28% |
| 596,244 | 584,434 | 11,810 | 2.02% | |
Figure 2: North Africa MPO Import Breakdown
Sub-Sahara Africa (SSA)
Malaysian palm oil exported to Sub Sahara Africa markets during Jan – Oct 2023 reached almost 2.5 million MT. The volume is 30% or 563,124 MT higher than the volume recorded in 2022. Kenya continue to be the leading importer of Malaysian palm oil in SSA, imported 725,911 MT of Malaysian palm oil and the volume accounted for 30% of the total MPO volume exported to the region. The volume was 16.08 % higher that the volume recorded in 2022.
Most of other markets in SSA have also recorded an outstanding import growth in 2023 with the exception of South Africa and Angola which recorded declines of 10.33% and 65% respectively. Higher uptake of Malaysian palm oil in some markets were due to higher demand for CPO and CPL.
| Table 4: Malaysian Palm Oil Export to Sub- Sahara African Countries | |||||
|---|---|---|---|---|---|
| COUNTRY | Jan – Oct 2023 | Jan – Oct 2022 | Diff (Vol) | Diff (%) | |
| 1 | Kenya | 725,911 | 625,371 | 100,540 | 16.08% |
| 2 | Tanzania | 294,675 | 188,015 | 106,661 | 56.73% |
| 3 | Nigeria | 263,106 | 171,011 | 92,095 | 53.85% |
| 4 | Mozambique | 210,015 | 187,005 | 23,010 | 12.30% |
| 5 | Togo | 205,275 | 98,528 | 106,746 | 108.34% |
| 6 | Benin | 136,132 | 72,239 | 63,893 | 88.45% |
| 7 | Senegal | 120,135 | 60,869 | 59,266 | 97.37% |
| 8 | South Africa | 103,774 | 115,727 | (11,953) | -10.33% |
| 9 | Mauritania | 88,773 | 36,413 | 52,360 | 143.80% |
| 10 | Madagascar | 72,772 | 62,096 | 10,676 | 17.19% |
| 11 | Ghana | 64,842 | 58,212 | 6,629 | 11.39% |
| 12 | Angola | 40,267 | 113,772 | (73,505) | -64.61% |
| 13 | Cote D’Ivoire | 30,463 | 20,312 | 10,151 | 49.97% |
| 14 | Congo, Democratic Rep. Of The | 27,279 | 29,085 | (1,806) | -6.21% |
| 15 | Guinea | 18,855 | 17,911 | 943 | 5.27% |
| 16 | Gambia | 15,588 | 10,732 | 4,856 | 45.25% |
| 17 | Cameroon | 11,236 | 8,071 | 3,164 | 39.20% |
| 18 | Liberia | 6,882 | 3,276 | 3,606 | 110.10% |
| 19 | Niger | 4,701 | 3,119 | 1,582 | 50.72% |
| 20 | Mauritius | 3,394 | 2,197 | 1,196 | 54.43% |
| 21 | Gabon | 2,346 | 1,027 | 1,319 | 128.43% |
| 22 | Burkina Faso | 1,143 | 1,329 | (186) | -14.00% |
| 23 | Sierra Leone | 1,127 | 992 | 135 | 13.58% |
| 24 | Others | 4,693 | 2,948 | 1,745 | 59.19% |
| 2,453,383 | 1,890,259 | 563,124 | 29.79% | ||
| Source: MPOB | |||||
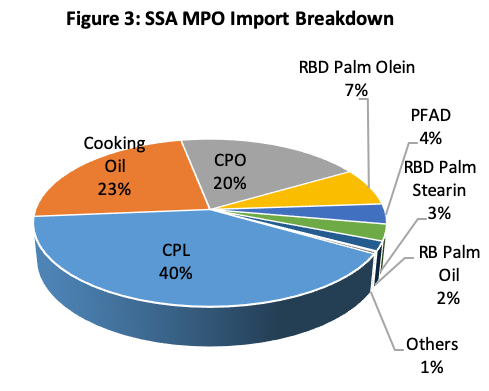
Breakdown of MPO Export to Sub-Sahara Africa
Crude palm oil (CPO, crude palm olein (CPL), and cooking oil are the main MPO palm oil products components going into the region. These three, accounted for 84% of the total palm oil imported by the region. CPL is the most imported palm oil component with market share of 42%. Lower crude oil import tax and the abolishment of import duty on crude products in market such as Tanzania has encouraged more imports of CPO and CPL by the region. Cooking oil accounted for 529,767MT or 24% of the total palm oil imported by the region. Benin, Togo, Mauritania, Tanzania, Kenya and Senegal were among the major importers of cooking oil in Africa.
| Table 5: Break down of MPO Export to SSA Market | ||||
|---|---|---|---|---|
| PRODUCT | Jan – Sept 2023 |
Jan – Sept 2022 |
Diff (MT) |
Diff (%) |
| CPL | 989,681 | 570,131 | 419,550 | 73.59% |
| Cooking Oil | 570,478 | 405,400 | 165,077 | 40.72% |
| CPO | 483,403 | 453,275 | 30,128 | 6.65% |
| RBD Palm Olein | 178,247 | 244,244 | (65,997) | -27.02% |
| PFAD | 95,414 | 91,819 | 3,595 | 3.92% |
| RBD Palm Stearin | 77,829 | 73,013 | 4,817 | 6.60% |
| RBD Palm Oil | 45,024 | 39,834 | 5,189 | 13.03% |
| RSPO Certified RBD PO and RBD PL | 3,997 | 4,259 | (262) | -6.15% |
| Others | 9,311 | 8,283 | 1,028 | 12.41% |
| 2,453,383 | 1,890,258 | 563,125 | 29.79% | |
*Disclaimer: This document has been prepared based on information from sources believed to be reliable but we do not make any representations as to its accuracy. This document is for information only and opinion expressed may be subject to change without notice and we will not accept any responsibility and shall not be held responsible for any loss or damage arising from or in respect of any use or misuse or reliance on the contents. We reserve our right to delete or edit any information on this site at any time at our absolute discretion without giving any prior notice.