SOUTH ASIA REGION
Malaysian Palm Oil Export to South Asia Region
(January – November 2023)
Regional Summary
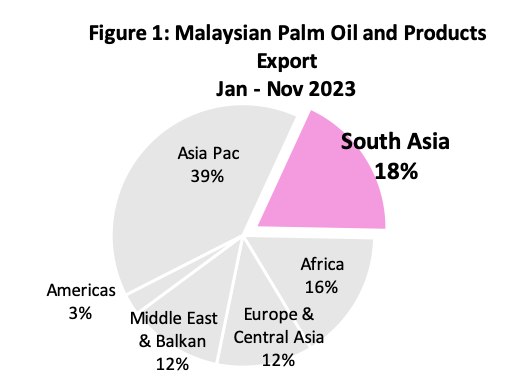
South Asia region accounted for 18% of the total Malaysian palm oil exported in Jan – Nov 2023. Palm oil assumed an important composition of Malaysian palm oil palm products exported to the region with market share 86% or 3,498,212 MT of the total Malaysian palm oil and products exported worldwide, followed by palm-based oleochemical (6%), palm kernel cake (4%), palm kernel oil (3%), and finished products (1%).
| Table 1: Malaysian Palm Oil and Palm Product Export to South Asia | ||||
|---|---|---|---|---|
| Products | Jan – Nov 2023 | Jan – Nov 2022 | Change (MT) | Change (%) |
| Palm Oil | 3,498,212 | 3,527,896 | (29,684) | (0.84) |
| Palm-Based Oleo | 254,043 | 241,673 | 12,370 | 5.12 |
| Palm Kernel Cake | 147,336 | 120,118 | 27,218 | 22.66 |
| Palm Kernel Oil | 127,269 | 111,431 | 15,838 | 14.21 |
| Finished Products | 32,165 | 34,784 | (2,619) | (7.53) |
| Other Palm Products | 2,818 | 3,616 | (797) | (22.06) |
| Palm Biodiesel | 0 | 224 | (224) | – |
| Grand Total | 4,061,844 | 4,039,743 | 22,101 | 0.55 |
Source: MPOB
Featured Analysis
- During Jan-Nov 2023, India’s vegetable oil imports recorded an increase of 9% YoY to 14.75 MMT compared to 13.55 MMT imported during the same period previous year. Palm oil imports increased by 4% YoY to 8.63 MMT during this period compared to 8.30 MMT imported during same period last year.
- Soft oil (CDSBO+CSFO) imports reportedly increased by 17% YoY to 6.12 MMT compared to 5.25 MMT imported during the previous year. CSFO imports increased by 62% YoY to 2.77 MMT during Jan-Nov 2023. Improved supplies from the war hit nations Ukraine and Russia has led to higher CSFO imports. During the same period CDSBO imports declined by 5% YoY to 3.34 MMT.
- Soft oil import share increased by 2.75% to 41.50% of the total edible oil imports. Narrow spread between the soft oils and palm oil and favourable supply situation supported the higher soft oil imports during the current year.
- For Nov 2023, total India’s edible oil import was reported higher by 16% MoM to 1.14 MMT whereas it is lower by 25% compared to previous year. India’s palm oil imports increased by 24% MoM to 863,000 MT. Soft oil imports declined by 4% MoM to 279,000 MT.
- For Dec 2023, total edible oils imports are anticipated to be around 900,000 MT, lower by 18-20% MoM. Total edible oil port stocks are estimated to decline by 35-40% MoM to around 600,000 MT due to lower import demand and higher dispatches.
South Asia
During Jan-Nov 2023 period, MPO exports to the South Asian region registered a total of 3,498,212 MT against 3,527,896 MT which was registered during the same period of last year, a decrease of 29,684 MT or by 0.84%. India holds the biggest market share of 72% as the largest importer of MPO in this region. The markets with positive import growth are Afghanistan, Bangladesh and Sri Lanka. Afghanistan recorded a significant import growth of cooking oil import from 194,699 MT to 246,350 MT.
| Table 2: Malaysian Palm Export to South Asian Countries | |||||
|---|---|---|---|---|---|
| COUNTRY | Jan – Nov 2023 | Jan – Nov 2022 | Diff (Vol) | Diff (%) | |
| 1 | India | 2,531,473 | 2,582,060 | (50,587) | (1.96) |
| 2 | Pakistan | 461,404 | 496,217 | (34,813) | (7.02) |
| 3 | Bangladesh | 224,393 | 217,581 | 6,812 | 3.13 |
| 4 | Afghanistan | 246,669 | 196,179 | 50,490 | 25.74 |
| 5 | Sri Lanka | 21,890 | 19,834 | 2,056 | 10.37 |
| 6 | Nepal | 6,426 | 8,641 | (2,215) | (25.63) |
| 7 | Maldives | 5,908 | 7,384 | (1,476) | (19.99) |
| 8 | Bhutan | 49 | 0 | 49 | – |
| 3,498,212 | 3,527,896 | (29,684) | (0.84) | ||
Source: MPOB
MPO exports to India during Jan-Nov 2023 marginally decreased by 1.96% from 2,582,060 MT to 2,531,473 MT. During this period, palm oil imports from Malaysia declined by 19% YoY to 2.72 MMT meanwhile palm oil imports from Indonesia and Thailand increased by 19% and 3% to 4.82 MMT and 0.78 MMT respectively. This has resulted in a decline of Malaysian palm oil import share from 40% to 32% whilst Indonesia palm oil import share increased from 49% to 56%. Favourable import policy and prices have supported the higher imports from Indonesia. Thailand import share marginally declined to 9.1% during this period.
Breakdown of Malaysian Palm Oil Export to South Asia
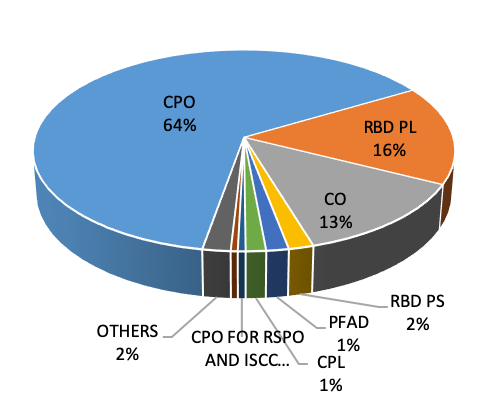
In terms of breakdown, the biggest product being exported to the region during Jan-Nov 2023 period is crude palm oil (CPO) accounting for 64% of overall palm oil imports followed by RBD palm olein (RBD PL) with 16% and cooking oil with 13%. These three palm oil products accounted for 93% of the total MPO exports to this region. Among the major importers of Malaysian CPO are India and Pakistan and major destinations for Malaysian RBD PL are India, Pakistan and Bangladesh. Cooking oil exports have also increased from 418,053 MT to 455,757 MT with major destinations include Pakistan and Afghanistan.
| Table 3: Break down of MPO into South Asia Market | ||||
|---|---|---|---|---|
| Jan – Nov 2023 | Jan – Nov 2022 | Diff (MT) |
Diff (%) |
|
| CPO | 2,233,352 | 2,136,357 | 96,995 | 4.54 |
| RBD PL | 554,507 | 722,322 | (167,815) | (23.23) |
| CO | 455,757 | 418,053 | 37,704 | 9.02 |
| RBD PS | 61,472 | 49,339 | 12,133 | 24.59 |
| PFAD | 48,241 | 54,296 | (6,055) | (11.15) |
| CPL | 44,384 | 26,986 | 17,398 | 64.47 |
| CPO FOR RSPO & ISCC | 16,454 | 26,699 | (10,246) | (38.37) |
| PAO | 16,247 | 20,465 | (4,218) | (20.61) |
| Others | 67,800 | 73,379 | (5,579) | (7.60) |
| 3,498,212 | 3,527,896 | (29,684) | (0.84) | |
Figure 2: South Asia MPO Import Breakdown
For more info please contact Mrs Azriyah Email : azriyah@mpoc.org.my
*Disclaimer: This document has been prepared based on information from sources believed to be reliable but we do not make any representations as to its accuracy. This document is for information only and opinion expressed may be subject to change without notice and we will not accept any responsibility and shall not be held responsible for any loss or damage arising from or in respect of any use or misuse or reliance on the contents. We reserve our right to delete or edit any information on this site at any time at our absolute discretion without giving any prior notice.